Pi-Osc instructions for Tradestation and MultiCharts with open code.
 Instructions for using Precision Index Oscillator in NinjaTrader, Tradestation and Multicharts |
For Importing into Tradestation Open power editor select file, import export Choose import Easy Language Archive fileSelect PIOSC_PW.ELA and PIOSC_INDICATOR.ELA Verify them both ( usually this is automatic in Tradestation, but has to be done manually in Multicharts ) You are now ready to use Pi-OscPlotting Pi-Osc in Tradestation Open a chart window, making sure you have loaded up at least 250 bars of data, right click the screen and choose "Insert analysis techniques" choose Pi-Osc from the indicator list then click ok. Then go to scaling and select scaling "screen", and go to properties and set the max number of bars study will reference to autodetect, and set sub-graph two, and tick the box "update every tick" Click ok. At this stage you edit the colours of PIosc to suit your needs. Open power editor and then open the Piosc indicator, you will see the colours typed into the code, which you can change. Once altered you can click verify. |
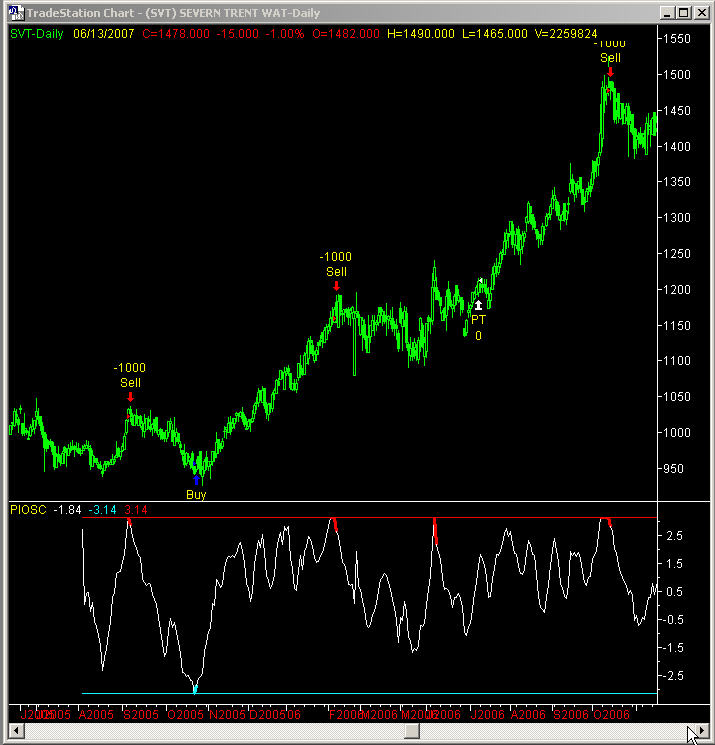
How to use Pi-Osc for trading signals. Pi-osc has a range of between +3.14 and - 3.14 and is an oscillator type indicator. It is not a trend following model. Signals generated are rare. Signals are generated when after the extreme reading of + or - 3.14 is reached, the oscillator retreats back away from that level. This is the essential point and it is covered in greater detail here It is not recommended to trade as soon as Pi-Osc hits 3.14 as its possible to stay locked at Pi extremes for several bars or days in a row. Buy signal generation. Pi-osc achieves -3.14 and the highlight shows clearly in cyan colour, when the indicator rises above -3.14, the signal is generated Sell signal generation. Pi-osc achieves +3.14 and the highlight shows clearly in red colour, when the indicator falls below +3.14, the signal is generated Trade exits signal generation. The Pi-osc delievers rare signals, (approximately 1 signal every 300 bars on average), therefore it is also rare that a buy signal will run right up to the other extreme and generate a sell signal, and vice versa. To get the best from Pi-Osc use a trailing stop which is adjusted to suit your preferences. Trade entries can be confirmed by waiting for the minor trend to change after each Pi event. Example confirmations can be a 10 bar high or low, a moving average cross over or a moving average that changes direction. Its wise to be early, but its also wise not to be too early, so wait for a bit of strength after a -3.14 is achieved. |
Adjusting trade frequency. If you want Pi-Osc to generate signals more frequently, then try reducing time frame sampling of you chart bars. E.G If on a daily chart you wish to see more signals, then try reducing to 6 hourly bars, or 4 hourly bars. If you find Pi-Osc generates too many signals on a 1 minute chart, then try increasing to 2 minute or 3 minute bars. With most technical trading signals, the lower the signal frequency the more reliable the signal becomes, and better results are generally achieved with slower time frames. Monitoring multiple instruments Open radar screen in Tradestation, and add all the symbols you wish to monitor, then add Pi-Osc to the indicator list, and select auto sort. You can then have an at a glance snapshot and be alerted when a signal is generated. The chart example below shows the signals generated by the code example below on a daily chart. (Set to only allow 1 trade per position) The PT exit was generated by parabolic trailing stop set with AF to 0.005 and first bar multi set to 4. |

|
For programming into systems. (Signals for strategies) Important note: For signals and strategies, PIOSC_PW requires 201 bars of data , so when adding a strategy to a chart, click on properties and then set max number of bars strategy will reference to 201) Due to the sheer mass of mathematic calculations done by Pi-Osc it takes approx 7 seconds to attach a strategy to a chart if 3 years of data is plotted. Once added Pi-Osc only has to compute the current bar, so the speed is very fast in execution. PI-Osc comes with a function called PIOSC_PW which has no input values. To make a signal based on PIOSC_PW achieving + or - 3.14 on the previous bar and then tracing back away from Pi during the current bar the code may read as follows Tradestation code. Old format If PIOSC_PW[1] = 3.14 and PIOSC_PW < 3.14 then sell; If PIOSC_PW[1] = -3.14 and PIOSC_PW > -3.14 then buy; Multicharts code. Which is the same as the Tradestation new format If PIOSC_PW[1] = 3.14 AND PIOSC_PW < 3.14 then sellshort next bar at market; If PIOSC_PW[1] = -3.14 AND PIOSC_PW > -3.14 then buy next bar at market; |
| Using Pi-Osc
and other indicators in NinjaTrader market analyser Open market analyser and populate it will a list of stocks such as the Dow Jones 30 or Nasqaq 100 ( SP500 is a bit much to begin with ) Delete all the columns apart from last price. Click columns and choose indicator -Pi-Osc The important part Set to daily 1 Plot 0 Days back 300 calculate on bar close bars to reference to infinite If you want colour coding shades Set max background to a up colour like blue min background to a down colour like red click apply..........wait a while for everything to populate and the button will cease being grey, then click ok when it allows you The list will populate with Pi values ( Screenshot below, just copy the settings for daily data) Video tutorials You can find video demonstrations on this page Video of signal formation is on this page Comprehensive Videos showing how to use Pi-Osc in combination with other indicators in a strategy combination |
| New Product guide over all trading platforms and products |
-
| Dr Spock says: Captain I suggest we install the Precision Index
Oscillator immediately to avoid bad trades |
How many ears does Dr Spock have? Three A left ear, a right ear and a final front-ear |
-
| See Fletcher the incredibly talented border collie.
Trading the FTSE 100 futures, playing guitar and piano During this trade Fletcher used Elliot wave theory and not Pi-Osc...See what happens |
I trained him myself. What else do you expect? |
-
|
Some amazing trading stories can be found here. Some interesting philosophical quotes can be found here. Trading IQ Game with PTS products as prizes Risk management in the sense of protection from market crashes with guidelines on stops to enter shorts. Optimal trade size for maximum gains Beginners and intermediate traders guide tutorial in six parts with examples and diagrams |
-
|
 |
 |
Admin notes Page modified 15 Dec 2023 video above other for phone friendly use


