![]()

|

|

|

|

|

|

|

|

|

|

|

|

|
Depth Gauge - Filtered pattern recognition trading system and indicator
New concepts are used to identify a reliable entry signal which can produce semi-scalping performance ratios or semi-trend following ratios depending on exit settings
|
|
|
 |
 |
|
Delivering a signal based on two variants of reliable fractal pattern recognition which gives a very early and efficient entry for a trading system for intermediate and expert traders.
|
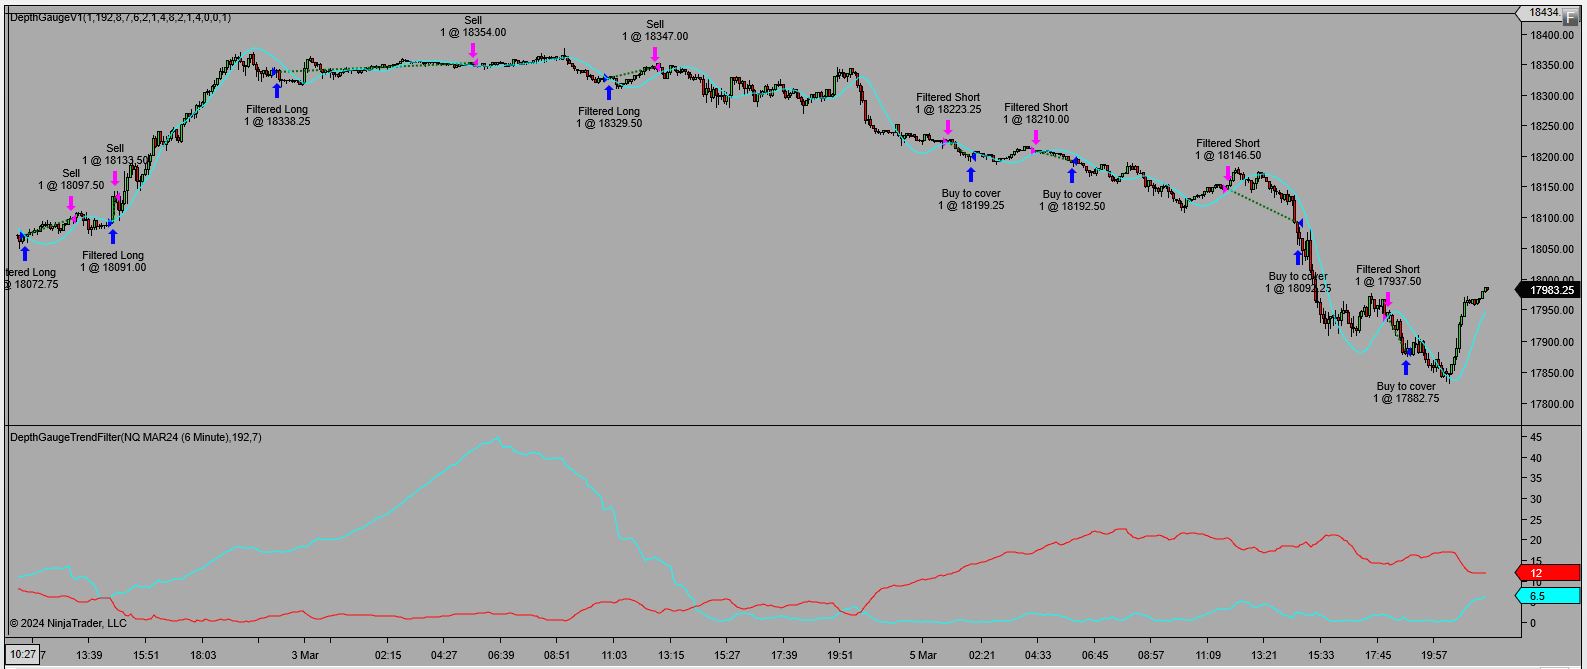
The Depth Gauge strategy measures the consolidation periods and enters early when minor strength is observed. The clever part is measuring the consolidations. As a smooth equity curve is a desirable attribute that is asked for often, this strategy provides the solution to reduce stress of big drawdowns in trading accounts. Lower panel the Depth Gauge trend filter demonstrates clearly when to leave long trades alone as the red line crosses above the blue line indicating bearish action. |
 |
|
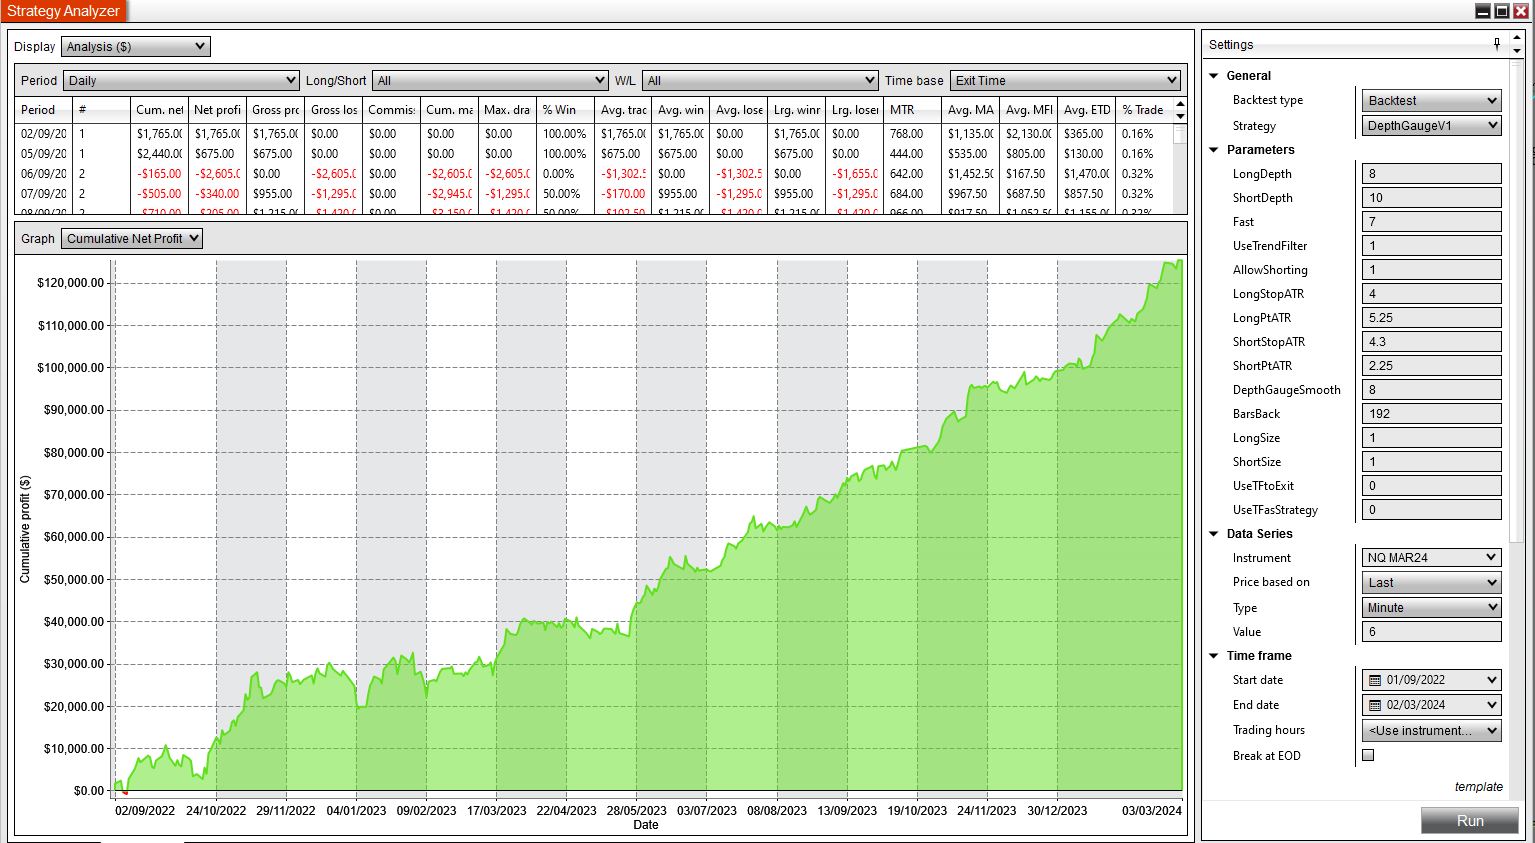
Intra day Traders will enjoy using this strategy in shorter term time frames. The above chart and strategy report below is NQ futures on 6 minute chart. This strategy operates with single trade pattern recognition signal which has a good probability of success. The settings can be modified to vary the pattern depth. |
 |
|
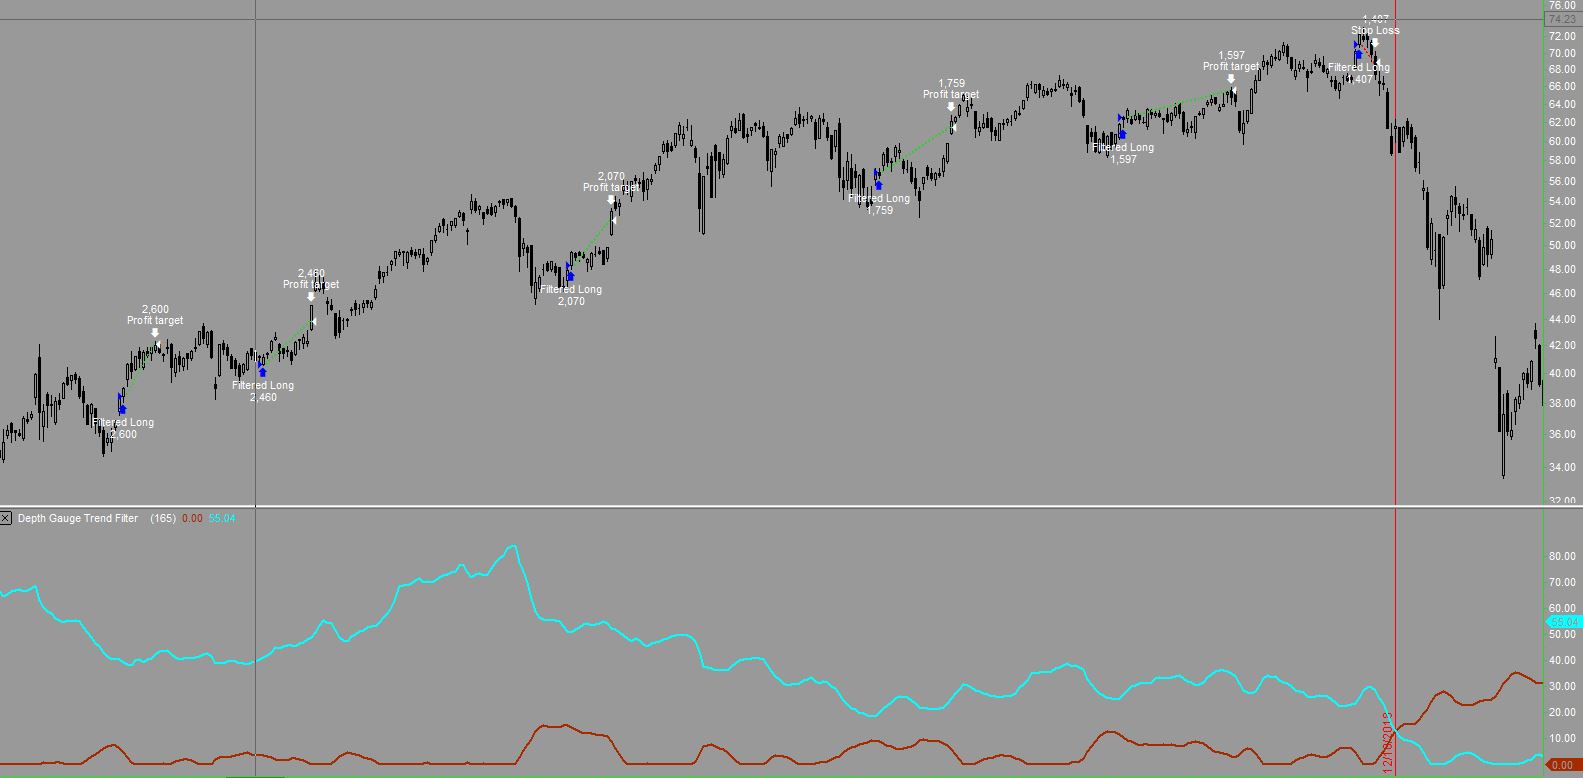
Alternatively, those who like things a bit slower can use it on daily charts. |
 |
- Setting up the Depth Gauge strategy is very simple and its trend indicator gives binary clarity on the prevailing market conditions expressed as a 1 or a 0 -
- Market selection is important - This strategy is primarily designed for bull markets and does not enter longs during big declines if the trend filter is turned on -
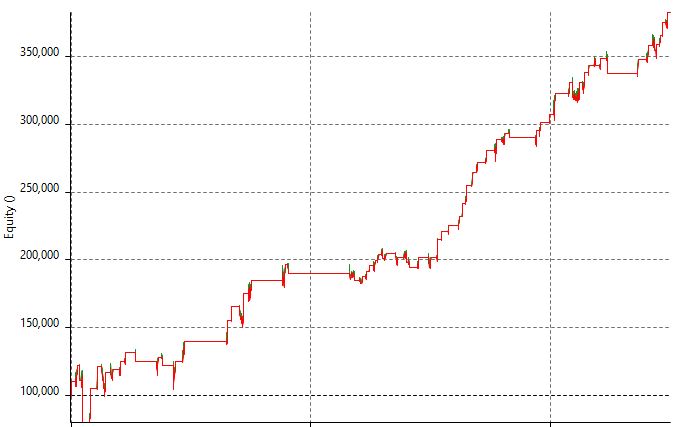
In the images below which is the first set up of the Depth Gauge strategy. Testing begins with target exit and stop loss exit set to the same value of 2 x Average True Range (ATR)
Clearly it can be seen that the smoother equity curve on the right is assisted by trend filter negating the long entries during the minor rallies which come inside the bigger market dips
Also it must be understood that this filtering will sheild the trader from excessive volatility which often occurs near market bottoms after big market declines.
I have been asked by several of my customers for a profit target strategy with a smooth equity curve, scroll down and look at the images change.
| 1st test with 2 ATR stop and 2 ATR target the trend filter is OFF | 2nd test with 2 ATR stop and 2 ATR target the trend filter is ON |
 |
 |
- Continuation of the set up can proceed after starting off with 2 Atrs stop and 2 Atrs target then the trend filter can be optimized carefully in coarse increments -
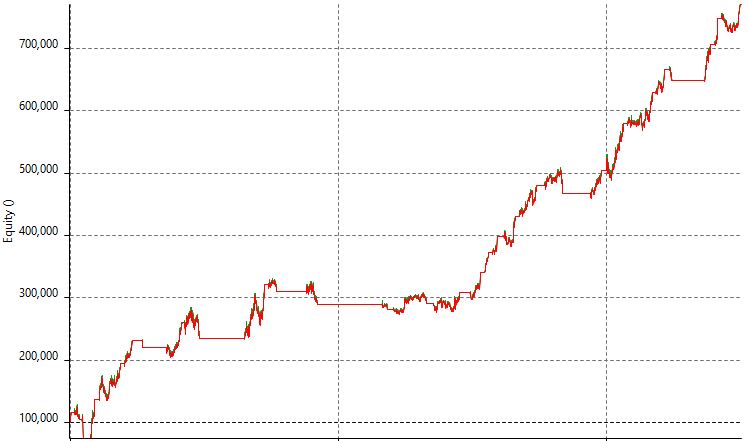
The look back period of the trend filter indicator can be tested from length 50 to 500 in steps of 10. In the sample test the best lookback was 180 bars.
Remember this is to establish the important things first or getting the bigger picture approximately correct before doing fine tuning. In this test depth 8 was best.
| Now the parameters can be adjusted to suit
the personality of each individual - ~ Truly consider what
you are seeking
as a priority ~ Money is not the right answer. The right answer is going to be a set up that comfortably suits your trading character and is also producing great results Some sample results are shown in the table below basis of different exit settings. This is when applied to a strongly up market with the trend filter turned on. |
| If you are of a trading personality type that likes lots of
small winning trades then you can set the ATRs profit target to a
smaller value than the ATRs Stop value. As we move down the table note the decrease in percentage wins and an increase in profit factor and risk-reward ratios. In the below the trend filter is turned on. ~ Somewhere in the table are the approximate settings for your unique trading personality ~ ~ Please note this strategy is 100% fractal and just needs to find the Fractal Pattern Recognition (FPR) shape - Any time frame can be used ~ |
 |
| These results are by optimizing first by just one variable at a time. Then
optimizing the both the exit ATRS stop and targets at the same time. Please note, the foolish thing is to optimize all fields at once as this leads to curved fitted history that is unlikely to perform well in the future. |
-
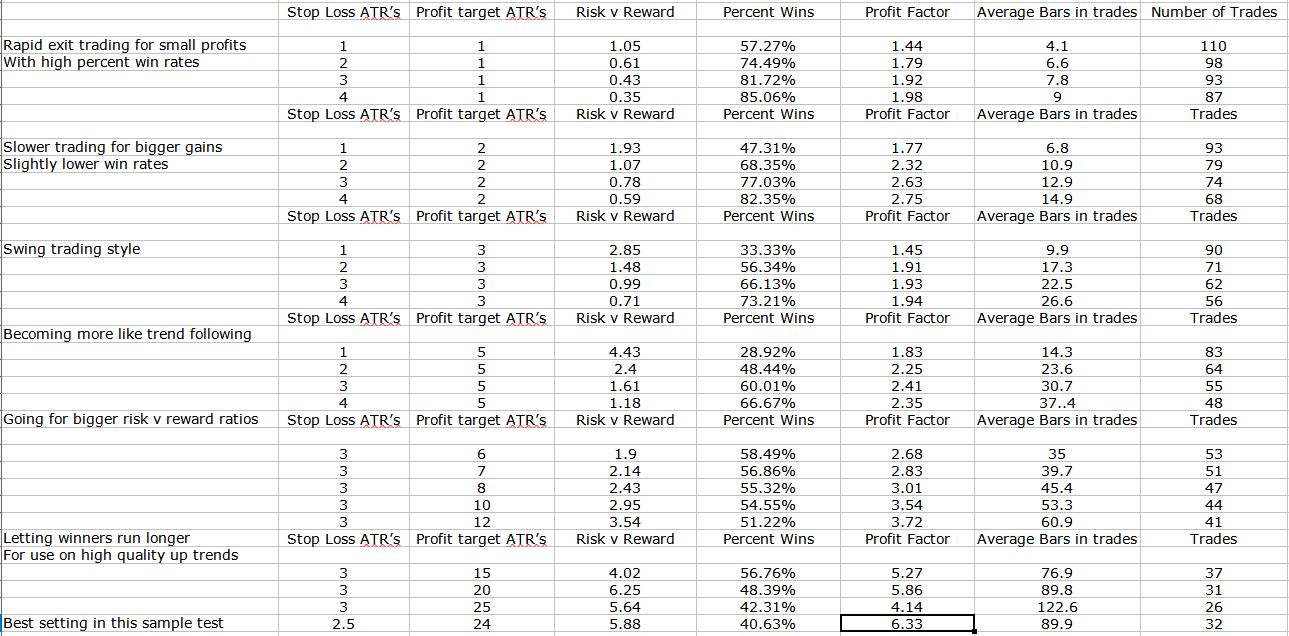
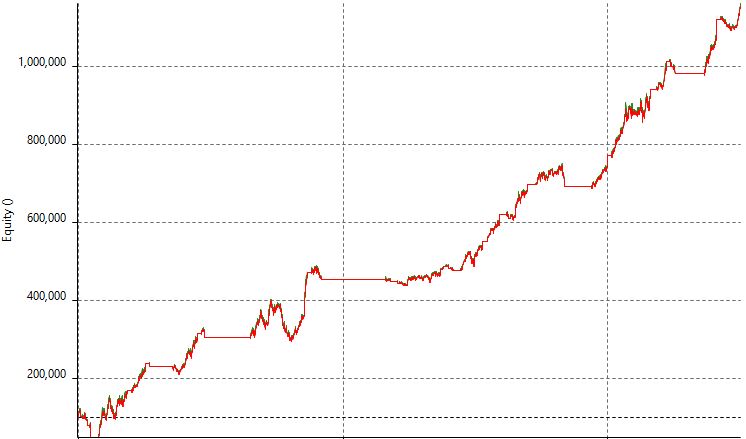
| The entry in the table above with 3 ATR stop and 12 ATR target. Trend filter = ON | The last test from the table with 2.5 ATR stop and 24 ATR target. Trend filter = ON |
 |
 |
-
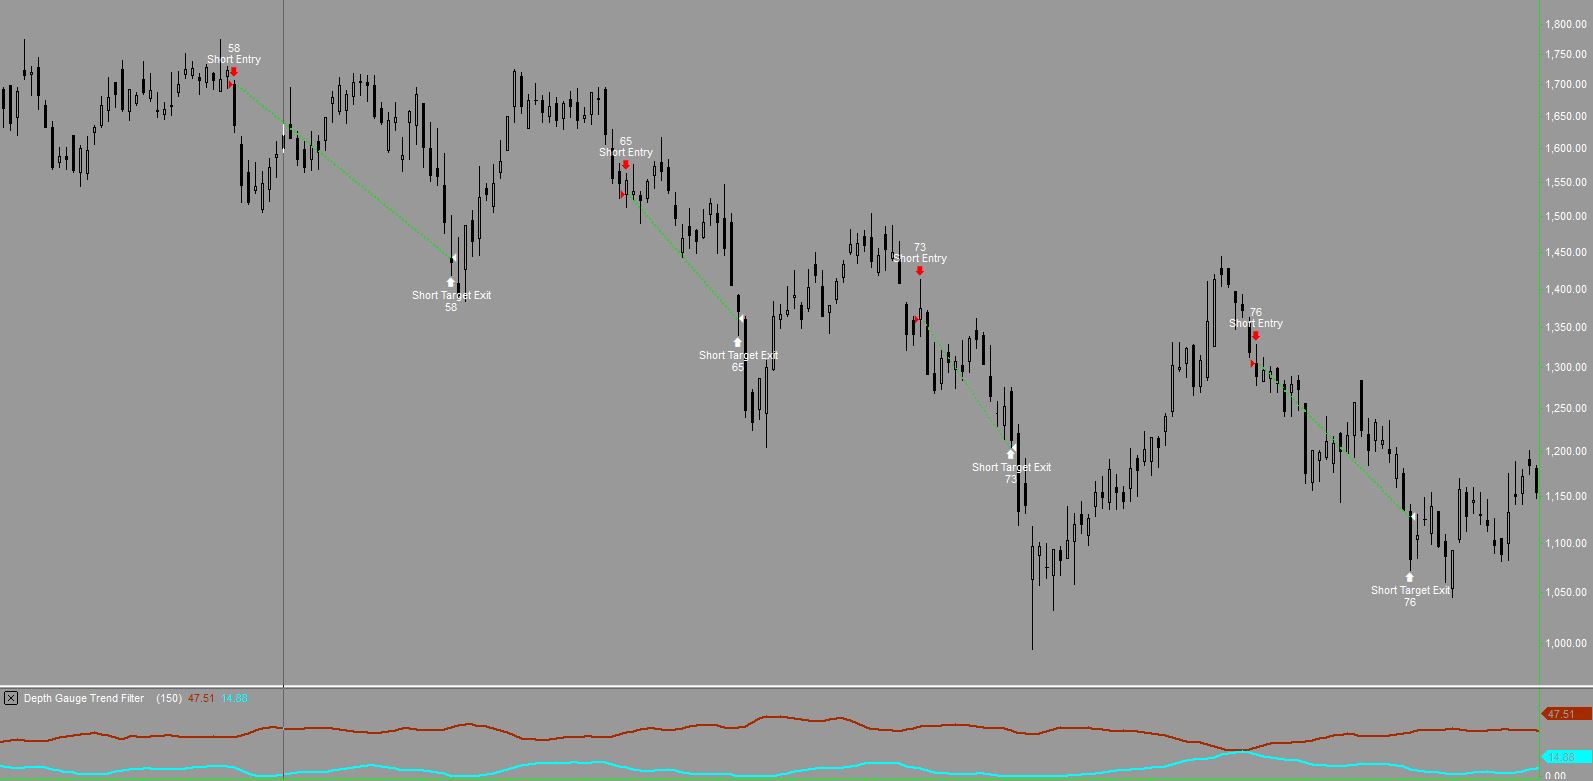
| The
next video clip shows the bearish signals. The trend filter is again shown in the
lower panel again Trend filter = ON and
Shorting = ON. |
-
The Depth gauge strategy picks reliable pattern recognition trades. The lower plot provides a binary reading for trend bull or bear situations
In the clip below
notice the transition from long mode into short mode and
only in the market when conditions were
suitable and a pattern is found.
Staying away from
unsuitable price action is the
cornerstone of its operation. Waiting for the fractal
pattern recognition { FPR} to happen Settings below are with shorting =
on and trend filter = on for general all round use on typical markets
-
|
List of features that
you can adjust and test to suit a very wide range of trading styles
from semi scalping to swing trading to semi trend following styles. Please note this strategy will NOT be sold to beginners or new customers unless first scoring > 1100 points in the Trading IQ Game (ask before buying) This is because experience in optimizations is needed to set this up correctly to suit your style and a beginner does not know what their trading style is yet. |
||||||||||||||||||||||||||||||||||||||||||||||||
|
||||||||||||||||||||||||||||||||||||||||||||||||
|
~ Technical information ~ |
||||||||||||||||||||||||||||||||||||||||||||||||
|
Markets that are suitable to use with Depth Gauge: Any
market with nice wave shapes, futures, forex, stocks,
cryptocurrencies, bonds, ETFs etc. Minimum time frames: Suggested minimum = 4-5 minute charts, some shorter time frames would work under favourable conditions. Maximum time frames: Weekly to Monthly charts. Chart types: Bars OHLC, or HLC Bars, Candlesticks, Line. Tick charts also work provided they are not too short term. Avoid exotic type charts like Renko, Kagi, Point and figure, Three line break charts, Heikin Ashi charts, as they usually give ficticious results in back testing by distorting the close price on the chart but cannot alter the market price! These are not "bad" chart types, far from it but the key element is that they filter the price action, and the depth gauge strategy would not be assisted by them. Try if you must but check time and sales against the reported fills in testing and it is likely that the prices are a long way from reality. Optimizing guidelines. Never optimize more than three variables at the same time. Better to do one or two or you can produce a curve fitted strategy that will not run well into the future. Start off with the table above and find the statistical payout win % and risk reward ratios that approximately suit your trading style. It is a good idea to begin testing with the target and the exit levels at the same value such as 3 or 4. Once this is done you can run optimizations on the short and long depths to find a setting that gives > 50% win rates. Test both at once in steps of 1. Please note if large numbers are used this will make the patterns increasingly rare. Anything above 20 depth could remove all the patterns entirely (no trades) and using small numbers to 1 or 2 can give way too many trades. Fast is an important variable to test as it is the minimum WMA that must be going in the trade entry direction. Test from 3 to 10 initially. Next is to test with the trend filter on or off. This gives the raw strategy freedom to take all trades. Compare the equity curves for on or off to suit your taste. Now an approximate suitable starting point is found, proceed to run through the long entry and exit ATRs in coarse steps of 1. (Do not fine tune ATRs in step of less than 0.25 as this again will lead to curve fitting and will only make you a backtest billionaire) Repeat for the short ATR exit and entries. Do these in pairs, one pair at a time, again in coarse steps. Next run over the barsback from 10 to 500 in coarse steps of 5 or 10. There will see huge differences in equity curves with this setting as it controls the speed of the Trend filter (TF). Please note the trend filter is very fast and when small numbers are used it can flip in the blink of an eye, the objective of the TF is to catch most of the big trends, to give assistance to the actual pattern trade entries, it is not for latching onto every little twist and turn. Decide if you will have short trades enabled or not, this is done by viewing the results. Usually the short trades will be less profitable than the long as most markets are in some form of uptrend. Of course there will be exceptions when the next big crash comes, remember to keep this in mind when deciding trade size. Lastly it is wise to test "useTFfIlterExit" which exits trades before the target or exit is reached if the trend filter changes direction. Sometimes this improves results, but not always. If you have a big account and notice the long trades are better than the shorts, you can make the long trade size a bit bigger than the short trade size. Once all the above are run through, retest two at a time through finer steps, but not too fine as in optimizing fine is dumb. The following settings have a binary 1 or 0 value which mean on or off. Allow shorting Use depth gauge trend filter Use TF Filter to exit The odd one out is the below. Use TF as the strategy (This final setting creates a totally different strategy which uses only the long and short size and the allow shorting feature. Trades are taken only when the depth gauge trend filter changes stance) |
-
|
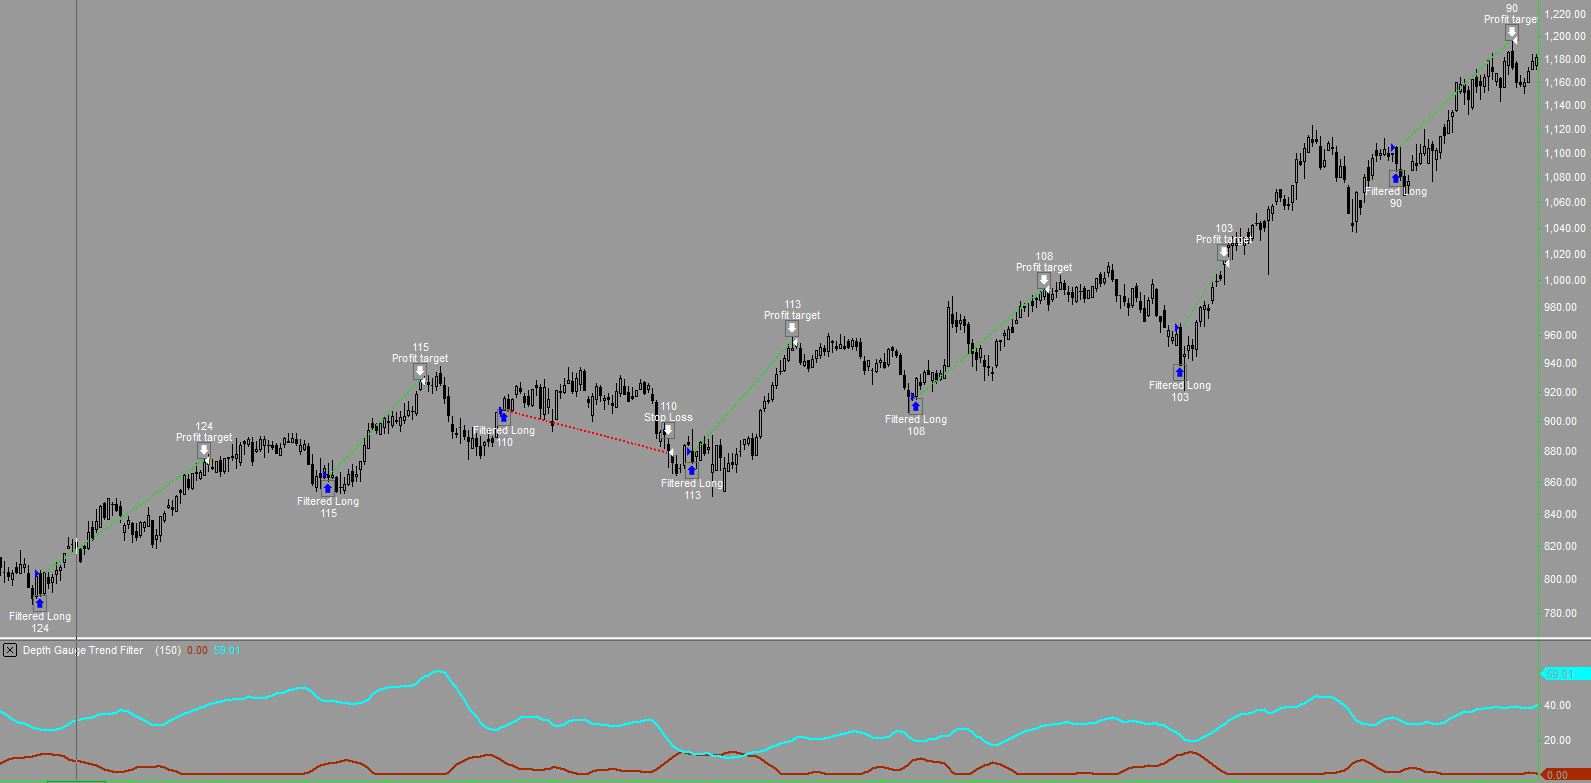
The Depth gauge strategy in action. This demonstrats how to strategy avoids high volatility price action and waits for the patterns This mode of operation is designed to give smoother equity curves and reduce risk and protect the trader from high stress trading. Keep your powder dry. Settings below are with 2 ATR Stop and a 6 ATR Target for general all round use on typical markets ( Allow Shorting = OFF Trend filter = ON ) |
-
|
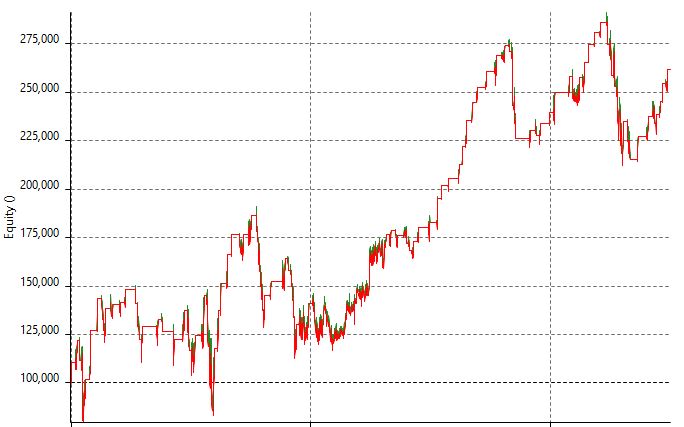
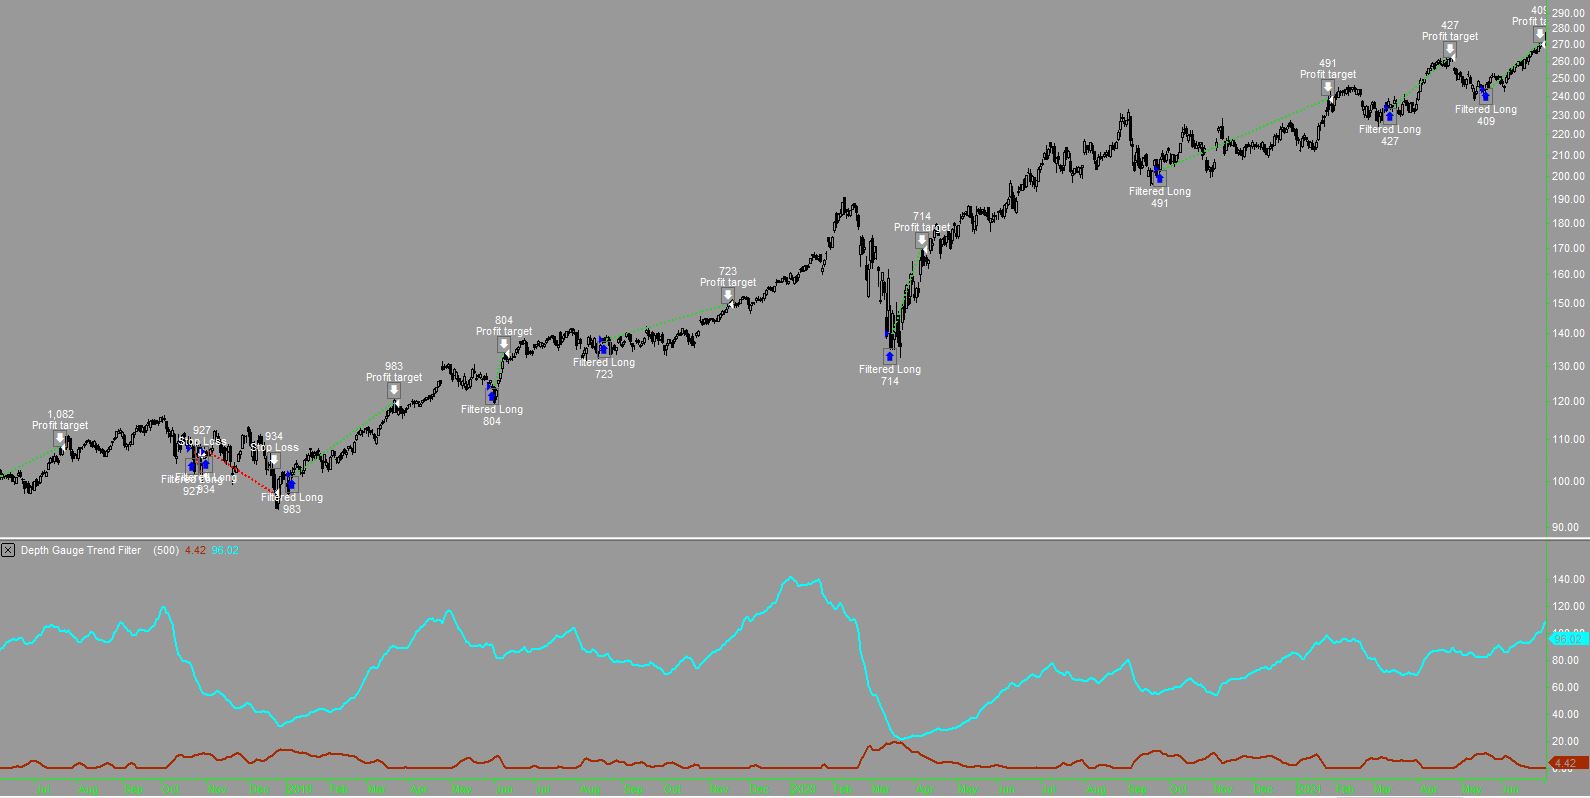
The Depth Gauge strategy depth gauge is very versatile. Below with BarsBack set to 500 it stayed bullish all through the Covid drama period in 2020. If a shorter value was entered then it would have obviously turned red (bearish) The image is provided to show the versatility rather than a suggestion as a long term investors may consider the market dives of 1929, 1973, 1987 or 2008 as "serious" but the Covid crash did not hurt markets such as MSFT much. |
 |
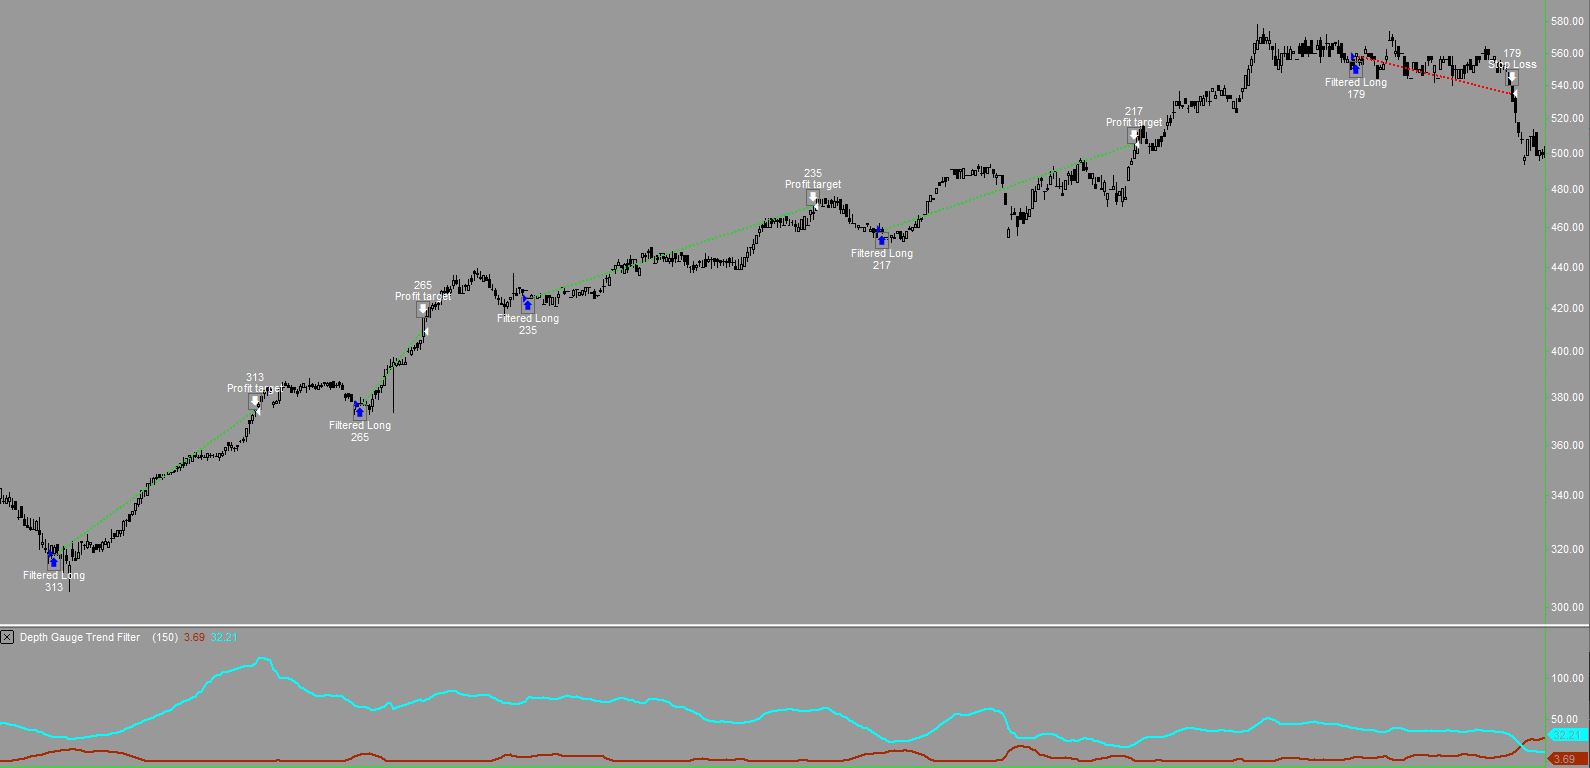
Below are shapes to look for in the charts that work well with this strategy. Note the trend filter (150 BarsBack Default) below stayed bearish throughout. 1. A highly suitable short shaped wave pattern defined by a sequence of lower lows and lower highs. These are easy to find if one studies market selection |
 |
|
2. A highly suitable long shaped wave pattern defined by a sequence of higher lows and higher highs. Occasional sequence failures can be forgiven if most are up. (There is a minor sequence failure in the centre as the low was lower than the previous low but still approximately equal to the low prior to it, these can be forgiven) Charts like this can be found EVERYWHERE if one takes time to look. The time frame is irrelevant, if the shapes appear in intra day data then the strategy will trade. |
 |
|
3. A highly suitable long shaped wave pattern defined by a smooth grind up without consistent shapes. These are found less commonly but they exist if you look. With this type of shape the results usually improve with increased Long Target ATR settings and regular exit settings. Below Long Target ATR = 10 and Exit level = 3 Please note the Depth Gauge strategy does not use stops, it uses at market orders which are never ignored. The reason is some stop orders can be ignored if placed too tight. So this is a safer method of using a strategy via autotrading. |
 |
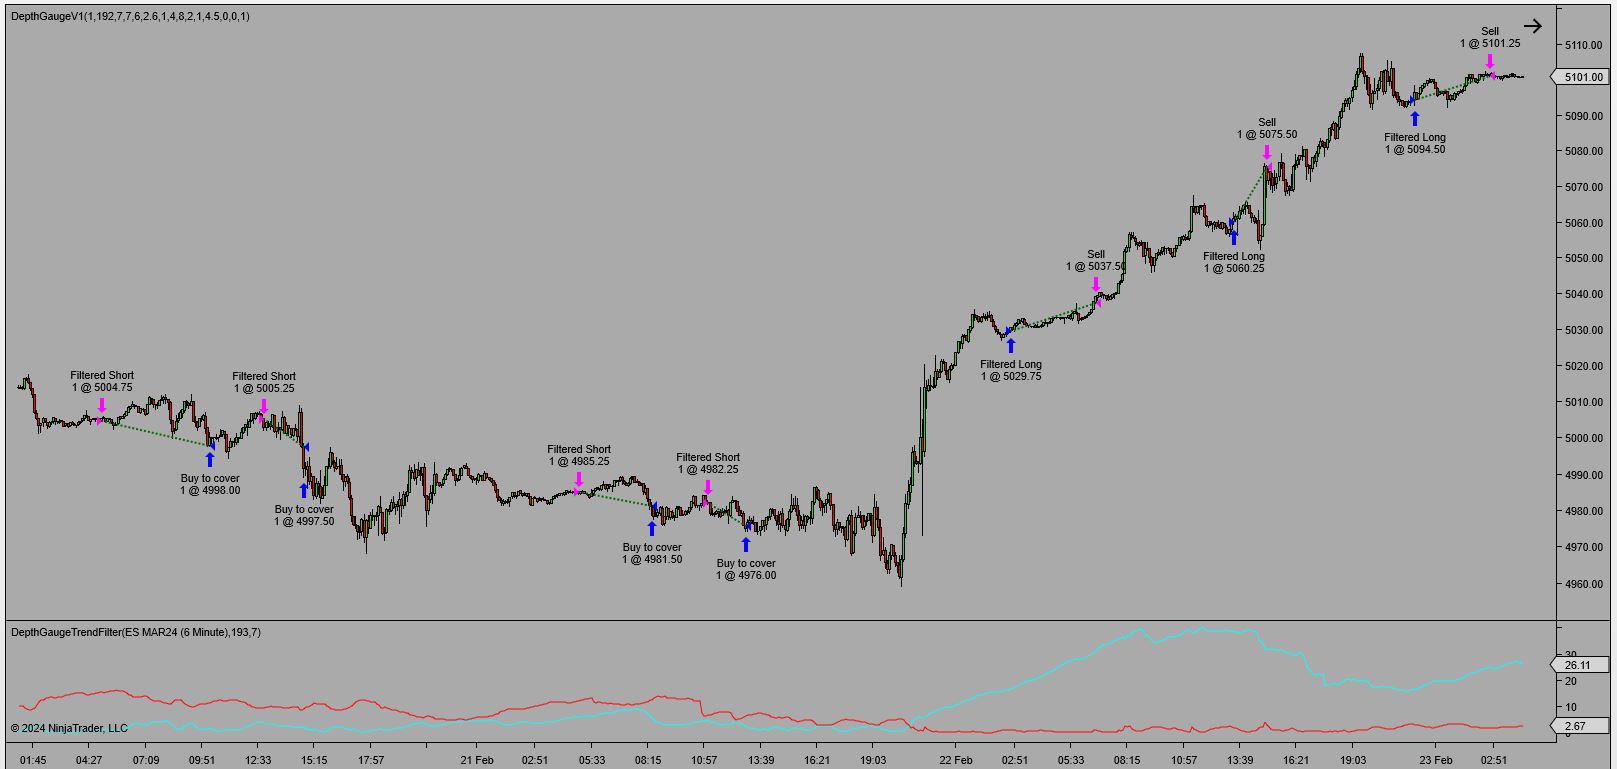
Below shows the Depth Gauge in use on the SP500 Futures ES with a 6 minute chart. Settings are the same as with the NQ chart above and the equity curve is also a friendly shape. |
 |
-
|
4. When the price action is more random the solution is often found by inverting the target and stop to upside down mode. Noted experts of trading usually concur that targets should ALWAYS be bigger than exit levels. What is the definition of an expert? X is an unknown quanity and a spert is a drip under pressure. The point is made. A generalisation and not always the case when price action is more random. Plenty of winning traders go for small gains with wide exits. Here the Long and Short Targets ATRs are set to 2 and the Long and Short stops are set to 3. Note that experts are not usually experts, they just think they are.
|
|
Payments will only be accepted from existing customers who have already purchased at least two PTS products. The Depth Gauge Strategy is NOT suitable for beginners or intermediates, sorry but I don't feel comfortable selling it if a trader lacks expertise. Existing PTS customers can get a 10 day trial for NinjaTrader for a small admin fee of 15 CHF (Approximately $17 USD) This discounted trial offer expires in a few days - March 17th View licenses for the NinjaTrader version and purchase View licenses for the MultiCharts version and purchase View licenses for the Tradestation version and purchase (Ready Soon) |
-
Please visit the sitemap and the entire product guide to find the correct trading system that you need
-
|


 |
|
|
| Admin notes |
| Page created on Feb 5th 2024 - Updated Feb 21st 2024 All social links added and cleaned up responsive page GA4 added canonical this. 5/5 html sm links added - responsive- No Gab Bday today |