![]()

|

|

|

|

|

|

|

|

|

|

|

|

|
Welcome to PTS Home of innovative trading systems and indicators
Supporting the below platforms and also offering bespoke trading system programming and private consultation services
|
|
|
 |
 |
|
Delivering a no nonsense approach to trading systems for experts and beginners. If you do not find what you are seeking in the site map, just ask me.
Some do badly at school then become successful, this is a lesson in tolerance. The product below has adjustable tolerance to allow "lesser" signals through.
Below are a few videos demonstrating some of the PTS trading systems. Each product page has detailed trading strategy instructions and images to aid selection.
|
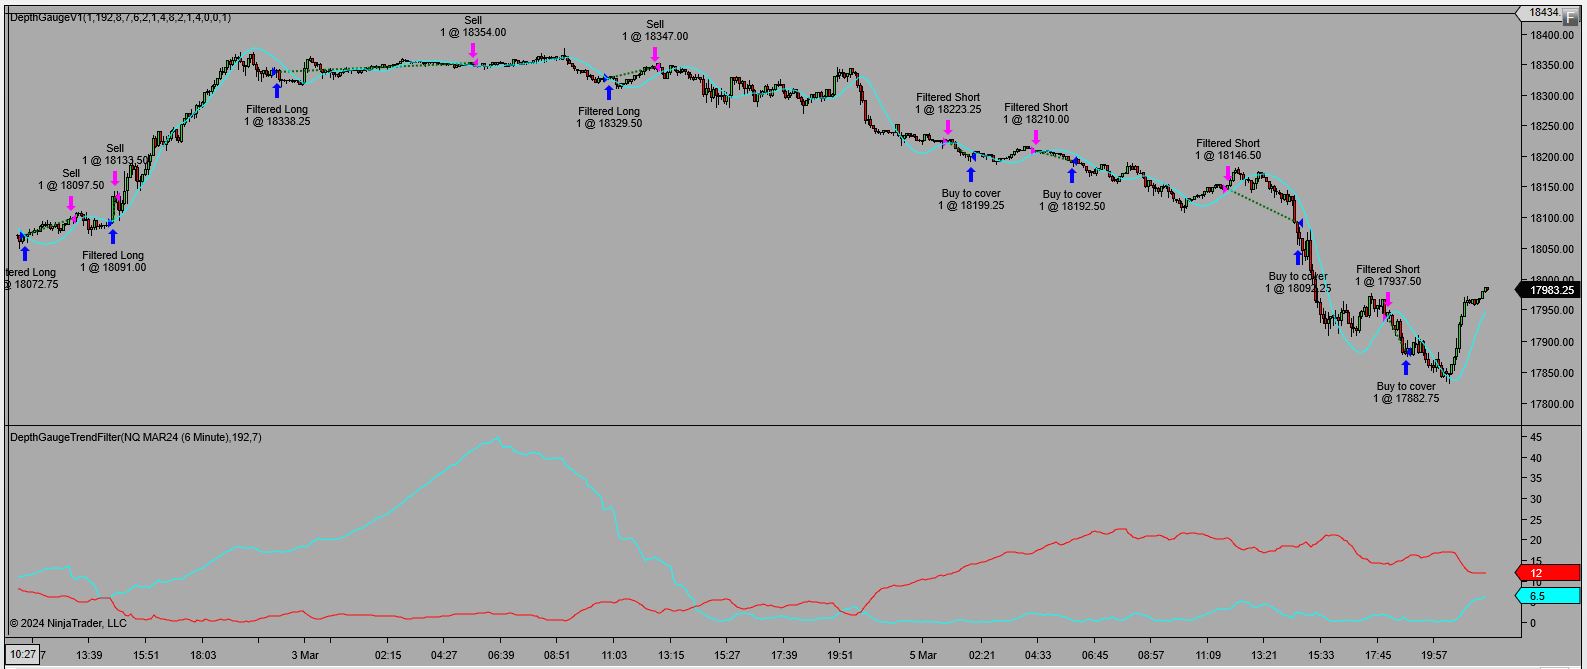
Depth Gauge - The pattern recognition trading strategy that uses solid and reliable pattern recognition - For existing customers only |
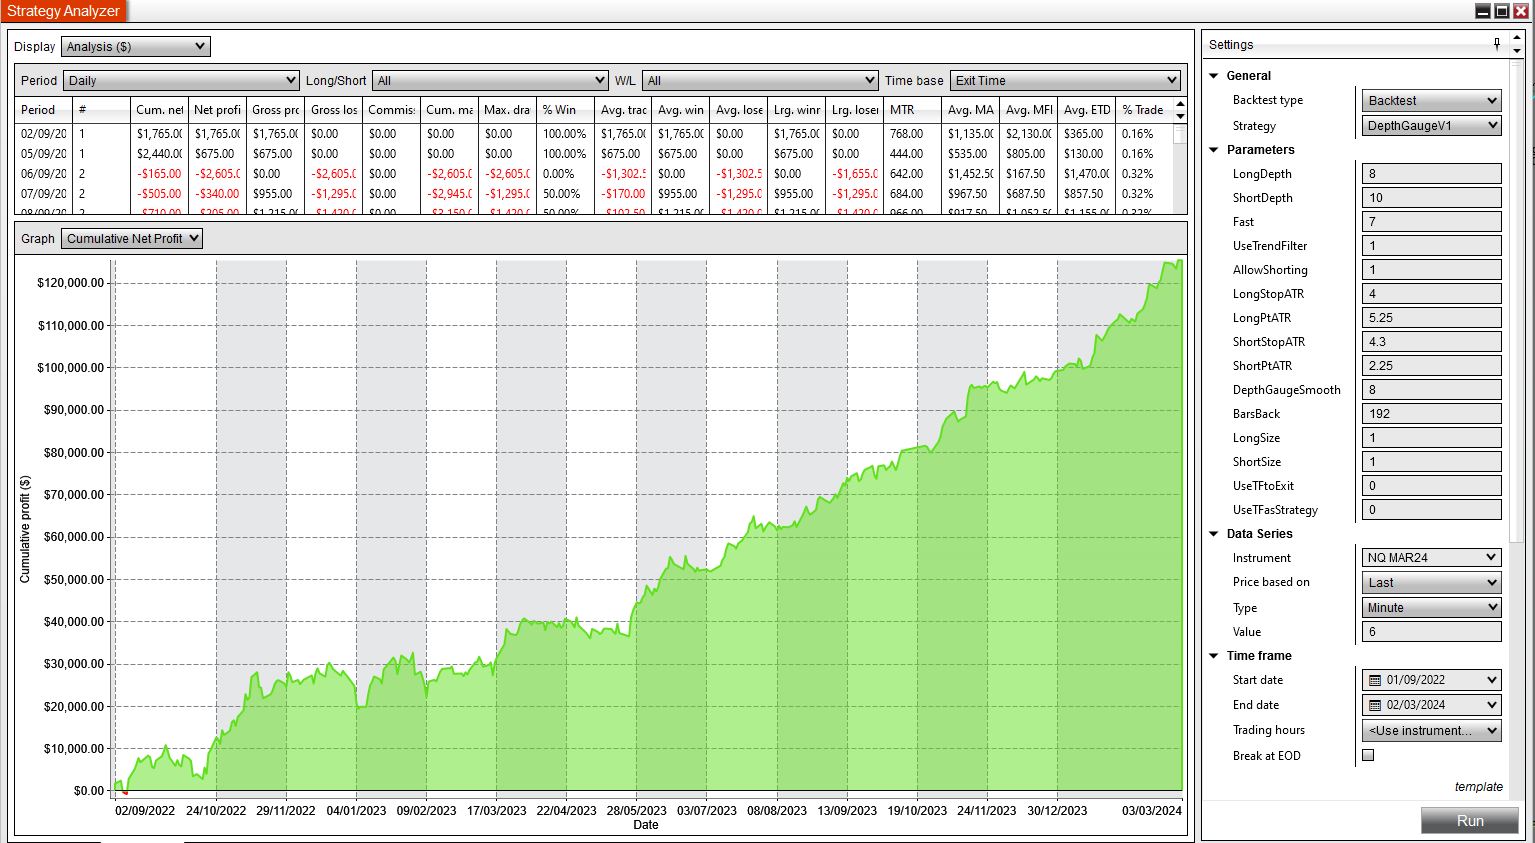 |
Day Traders will enjoy using this strategy in shorter term time frames. The above report and below shot is NQ futures on 6 minute chart. Depth Gauge read more This strategy operates with single trade pattern recognition signal which has a good probability of success. The settings can be modified to vary the pattern depth. |
 |
- PTS Supports these platforms, with trading strategies and indicators for NinjaTrader 7-8, MultiCharts, Tradestation, MetaTrader 4 -MetaTrader 5 and TradingView
Precision Probability Index strategy shown below on speeded up daily data.Note PPI has two different trading strategies with it. The one below is the more actively trading "signal line crossing" version. |
|
|
- Market selection is important - Match the market action to the trading strategy and great things can happen -
Precision Index Oscillator Pi-Osc is often quite adept at finding some precise tops and bottoms but not all. Suited to rangebound markets. |
- Markets are cruel sometimes - This is usually the result of institutional manipulation designed to force the stops of retail traders, can your trading system handle it?
Mach-Trend-Platinum Pro in action. The paint bar makes trend changes visually simple and the trading strategy avoids whipsawsDesigned to give good risk / reward ratios by trading less. The MT indicator is not plotted in this example, available for all platforms, see the product guide. |
Please visit the sitemap and the entire product guide to find the correct trading system that you need
Risk management Learning about risk management techniques, such as setting stop-loss orders, position sizing and maintaining discipline, will help you navigate the market with greater confidence. Trading offers an incredible learning experience. As a beginner, you'll have the opportunity to understand market dynamics, observe price patterns, and analyze technical indicators. Great traders know the importance of risk management. Expert traders know the importance of position sizing and risk management and sticking to the trading system. There is a lot of information on this subject that you can find in the calculator pages and these beginners guides. Schedule Table Precision Trading Systems list of future planned releases and recent updates
|
||||||||||||||||||||||||||||||||||||||||||||||||||||||||||||
-
|


 |
|
|
| Admin notes |
| Page created on Jan 25th 2024 - Updated Feb 5th 2024 All social links added and cleaned up responsive page GA4 added canonical this. 5/5 html sm links added - responsive- Bday today |